Top Carbon Reduction Strategies for Global Supply Chains?
Global supply chains are under growing pressure to reduce emissions without weakening resilience, affordability, or service quality. The World Economic Forum reported that supply chains account for about 60% of global greenhouse gas emissions. This figure makes procurement and logistics central to climate action. It also exposes a difficult reality. Many companies still measure their factories more carefully than their suppliers.
Effective carbon reduction strategies begin with reliable data. The CDP Global Supply Chain Report 2023 found that supply chain emissions are, on average, 11.4 times higher than a company’s direct operational emissions. That gap can appear in ordinary places: a steel component, a refrigerated container, or a final-mile delivery van. Companies should map Scope 1, Scope 2, and relevant Scope 3 emissions using the GHG Protocol. They can then prioritize renewable electricity, low-carbon materials, route optimization, supplier engagement, and demand forecasting. Small operational details matter. An overloaded truck, an urgent air shipment, or idle warehouse equipment can quietly increase emissions.
The International Energy Agency’s 2024 analysis also shows that heavy industry and transport need faster technology deployment and cleaner energy systems. Still, technology alone will not solve every problem. Supplier data may be incomplete, and emissions factors can differ across regions. That uncertainty deserves honest disclosure. A credible approach combines verified targets, practical supplier support, lifecycle thinking, and regular progress reviews. These strategies may not deliver perfect results immediately. They can, however, turn climate commitments into measurable decisions across purchasing, production, and distribution.
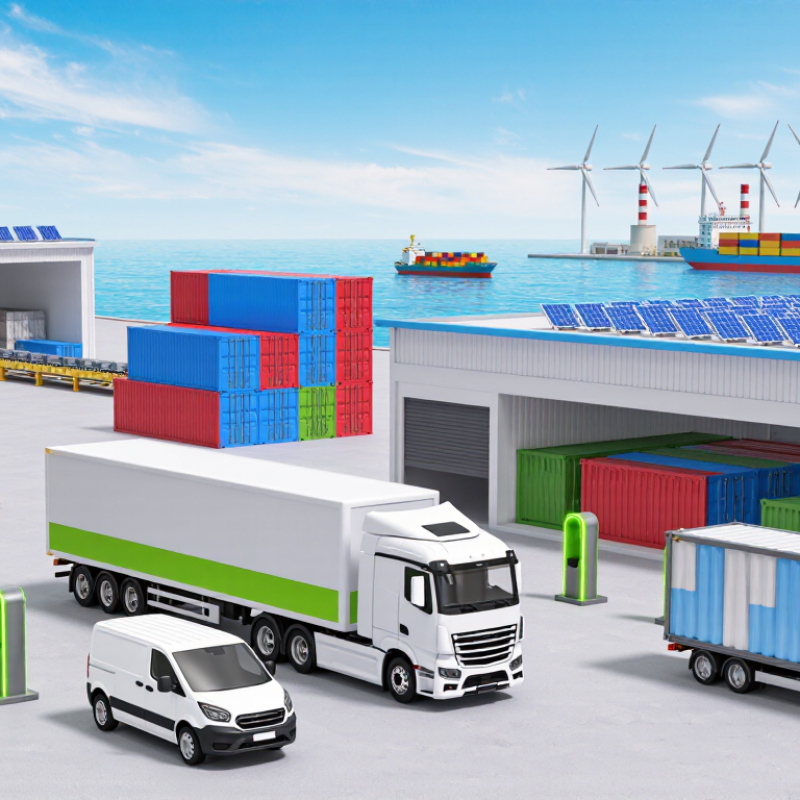
Map Scope 1–3 Emissions Using the GHG Protocol’s 15 Categories
A credible supply-chain decarbonization plan starts with a complete emissions map. Scope 1 covers fuel burned in owned boilers, vehicles, and factories. Scope 2 captures purchased electricity, heat, steam, and cooling. Scope 3 requires deeper investigation across the GHG Protocol’s 15 categories.
Trace purchased goods and services first. Then measure capital goods. Include fuel- and energy-related activities, upstream transport, and waste. Record business travel and employee commuting. Do not overlook upstream leased assets. Downstream transport follows. Processing, use, and end-of-life treatment of sold products also matter. Add downstream leased assets, franchises, and investments. The list feels excessive. It is still necessary.
CDP’s 2023 supply-chain research found that supply-chain emissions average 11.4 times operational emissions. That ratio makes supplier data more than a reporting exercise. The International Energy Agency reported that global energy-related carbon dioxide emissions reached 37.4 gigatonnes in 2023. Small measurement errors can therefore scale quickly. Use supplier-specific data where possible. Apply activity-based estimates when records are incomplete. Document assumptions beside every number. A spreadsheet may look precise while hiding weak evidence. Recheck transport distances, material weights, recycled content, and product lifetimes. The first inventory will probably be imperfect. That is useful, if each gap receives an owner, a deadline, and a better data source.
Prioritize Suppliers: Scope 3 Often Exceeds 70% of Corporate Emissions
Global supply chains often hide the largest carbon reduction opportunities.
Scope 3 emissions can exceed 70% of a company’s total footprint, although this varies by industry and reporting method. Purchased materials, freight, packaging, and product use can all dominate the impact.
Supplier prioritization makes action more practical.
Start with high-spend suppliers, carbon-intensive materials, and facilities in energy-heavy regions. Request activity data, emission factors, and evidence of renewable electricity claims. A spreadsheet is useful, but it should not become a substitute for verification.
Tips:
Create a supplier emissions map. Rank partners by carbon impact and data quality. Set measurable targets, such as reducing kilograms of carbon dioxide per product. Offer training for smaller suppliers. Their data may be weaker, but their operational influence can be significant.
Our first supplier questionnaire was too broad and produced inconsistent answers. We learned to ask fewer, clearer questions and provide calculation examples. Primary data remains preferable, yet estimated figures may be necessary during early assessments.
Record every assumption and review it annually. Do not reward impressive claims without checking boundaries, energy sources, and production volumes. A supplier may report lower emissions simply because important activities were excluded.
Independent review can expose these gaps. Progress is rarely clean. Better data often makes emissions appear higher before real reductions begin.
Shift Freight Modes: Rail Emits Up to 75% Less CO₂ Than Road Transport
Shifting suitable freight from road to rail can cut supply-chain emissions sharply. The International Energy Agency’s Future of Rail report estimates that rail carries about 7% of global freight but uses roughly 2% of transport energy. European Environment Agency comparisons show rail may emit up to 75% less CO₂e per tonne-kilometre than heavy road transport. The exact benefit depends on distance, train capacity, electricity sources, and loading efficiency.
Distance matters. A full train moving containers 800 kilometres can replace many long-haul truck journeys. However, trucks may still handle the first and final kilometres. These transfers create emissions through loading equipment, empty returns, and local deliveries. The Global Logistics Emissions Council Framework recommends measuring every transport leg, rather than reporting rail emissions alone.
Data can mislead. Comparing diesel rail with efficient road fleets may produce a smaller reduction. Comparing electric rail with poorly loaded trucks may produce a much larger one. Companies should use consistent CO₂e boundaries, including fuel production and electricity generation. They should also track tonnes moved, kilometres travelled, and empty capacity.
The practical move is selective conversion. Stable, high-volume lanes often suit rail best. Time-sensitive shipments may need road transport. A pilot lane can reveal delays, terminal congestion, and handling losses before wider investment. The calculation will not be perfect. Transparent assumptions make it more trustworthy.
Scale Renewable Energy to Cut Electricity-Related Scope 2 Emissions
Scaling renewable energy is one of the clearest ways to reduce electricity-related Scope 2 emissions across global supply chains. Companies can begin by mapping electricity use at factories, warehouses, offices, and logistics hubs. Then, they can compare local grid factors, renewable availability, and contract conditions. On-site solar may support daytime operations, while power purchase agreements or verified renewable certificates can address remaining demand.
Reliable progress requires more than buying renewable electricity on paper. Procurement teams should check whether projects are newly built, geographically relevant, and transparently verified. Hourly matching is also becoming important because annual certificates may not reflect actual clean power use during production. A factory running overnight may still depend heavily on fossil-based electricity. Data quality remains difficult. Supplier records can be incomplete, and emissions factors may differ between countries.
Tips: Set a renewable electricity target with a clear baseline and yearly milestones. Request meter-level data from key suppliers. Review certificate quality and project additionality. Pair renewable procurement with efficiency measures, such as efficient motors, smart controls, and reduced idle time. Pilot one production site before expanding globally. Small tests reveal practical problems.
A useful dashboard should track renewable share, Scope 2 emissions, energy intensity, and supplier participation. Independent assurance can improve credibility, but it does not replace operational knowledge. Some renewable projects may look ideal in reports yet fail to match local demand patterns. Regular reviews are necessary. Progress will rarely be perfectly linear.
Top Carbon Reduction Strategies for Global Supply Chains: Scale Renewable Energy to Cut Electricity-Related Scope 2 Emissions
Lifecycle greenhouse-gas emissions vary substantially by electricity source. Median values are based on IPCC assessment data and are expressed in grams of CO₂-equivalent per kilowatt-hour. Replacing coal- and gas-based electricity with renewable power can significantly reduce market-based Scope 2 emissions across global supply chains.